Multi-dimensional social policies to abate relative poverty
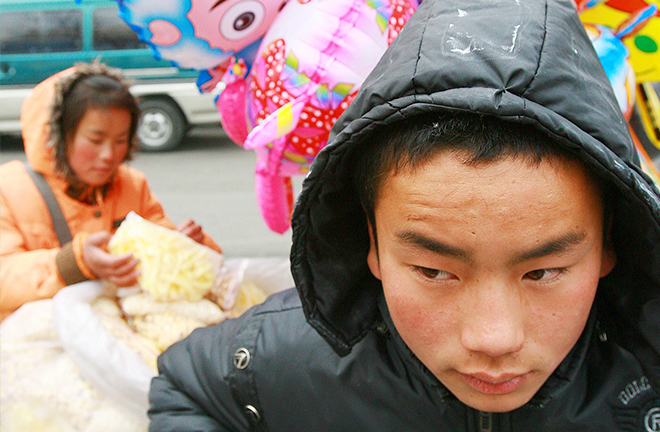
A middle school student takes a leave from school to sell balloons with his mother so that he could earn money for tuition. His parents are rural migrant workers in Beijing. Photo: CFP
With the rapid development of the national economy from 2015 to 2019, China eliminated absolute poverty in 2020. However, relative poverty has gradually emerged. The difference between relative poverty and absolute poverty is that relative poverty involves social issues such as group comparison and opportunity equality.
Theoretical progress
The research on relative poverty focuses on analyzing inequality caused by factors including social exclusion from multiple perspectives such as power relations, so as to promote social equality and social inclusion. In fact, social inequality was introduced into poverty research at its initial stage.
Some scholars defined social exclusion as a phenomenon where some individuals or groups are excluded from the society’s welfare system, with no equal access to public resources or the labor market, and social activities. For instance, affected by the Dual Household Registration System, people without a stable job are without the same social security or public services that the employed have. They can neither enter the labor market on a level playing field nor obtain protection from society. They are expelled from the welfare system. For historical reasons, migrant workers cannot have equal access to public services and social security as registered urban residents. Migrant workers have trouble accessing or affording medical services, while also finding it hard to enroll their children at school. Equal access to public services urgently needs to be promoted between urban and rural areas.
Scholars of social policies usually look at relative poverty in a multi-dimensional way. Traditionally, poverty or individual’s quality of life is usually measured by their consumption or total income. However, after the 1960s, scholars began to realize that it is not reasonable to take income as the only indicator of whether or not people’s basic life demands are met.
The 2015, 2017, and 2019 figures from the Chinese Social Survey (CSS) conducted by the Institute of Sociology at the Chinese Academy of Social Sciences (CASS) can perhaps offer us a multi-dimensional look into relative poverty in both rural and urban areas.
Job opportunities
According to the education level of subjects, the haves are better-educated than the have-nots. In 2015, the education level of non-poor people was mainly at the junior middle school level and above, while 56.67% of relatively poor people was mainly at the primary school level and below. Their average education level was much lower than that of the non-poor. This situation has not changed over time, and the gap between both sides remains. The vulnerable poor suffer from a condition of weaker human capital compared with that of the non-poor. Human capital decides whether individuals can adapt to the market. Relatively poor people are at a disadvantage in education, making them more vulnerable to unemployment.
Non-farm work is the major source of income for those living above the poverty line, whereas the poor tend to concentrate in the agricultural sector. A comparison between the two allows us to see that relatively poor people tend to be farmers, and the proportion of the relative poor doing non-farm activities remain low. In terms of the variation trend of the employment structure, the proportion of the non-poor population doing farming has dropped from 18.65% in 2015 to 15.86% in 2019, meaning that employment in agriculture shrank by nearly three percentage points. The non-farm employment rate remained unchanged during the same period, with a slight increase from 38.07% to 38.5%.
When we look at how the employment mix changed over time, we can see a nearly 1% increase of the non-agricultural employment rate generated by relatively poor people, with their engagement in non-farm activities rising from 11.17% to 12.35% from 2015 to 2019. Those who purely engaged in farming, on the other hand, saw an almost seven percentage point drop from 53.07% to 46.14% over the same period. That is to say, the relative poor have contributed to more changes in the employment structure than the non-poor.
China has been channeling the poor labor force into non-farm sectors as an important method of poverty relief, and a great number of the rural population have indeed escaped the poverty trap this way. Nevertheless, with a large number of relative poor moving towards non-agricultural industries, there is still a long way to go before we can abate relative poverty, which has many root causes to it.
The figures for 2019 indicate that 32% of respondents who were poor were unemployed. One of the reasons behind this might be the rural migrant workers’ lack of competitiveness, especially since technologies and industries are constantly being updated. As a result, they are either stuck in labor intensive industries as a low-wage labor force, or become jobless. Therefore, the gap in employment opportunities caused by weak human capital will not be automatically narrowed by the outflow of the rural labor force into urban areas. In a highly competitive labor market, migrant workers in lower-end industries are faced with the risk of falling back into poverty.
Social security
A good coverage of social security is the foundation for poverty reduction. China’s old-age pension coverage expanded from 54.40% of non-poor people and 50.71% of relatively poor people in 2017 to 59.14% and 53.94% respectively in 2019. In fact, before 2009, China’s basic pension schemes only covered urban residents, while leaving rural migrant workers out of the safety net. China began its pilot schemes on the “new rural social pension insurance” in 2009, when old-age insurance finally entered the picture in rural areas. Since then, the number of insured rural residents has begun to increase year by year.
Similarly, basic medical insurance has expanded its coverage over the years. The insurance rate for the non-poor and the relatively poor stood at 85.39% and 82.77% respectively in 2019, with the former slightly higher than the latter. It is the opposite case for subsistence allowances. 3.09% of non-poor received a subsistence subsidy in 2019, while 9.58% of the relatively poor are granted the subsidy.
Social participation
Individuals’ social participation is highly valued in sociology, and that is why the CSS questionnaire has also included many questions on this subject. This article has picked three indicators for political participation to make its point.
In 2015, the participation rate of the relatively poor in the elections of village and neighborhood committees was 50.61%, lower than that of the non-poor, which has a 59.08% turnout. From 2017 to 2019, both figures plunged. Non-poor residents’ voter turnout dropped by 29% in 2019, while the figure for the relatively poor decreased by 11%.
9.62% of the relatively poor and 9.16% of the non-poor took part in major decision-making discussions in 2019. Generally, Chinese residents’ social participation was low, however, the relatively poor were slightly more active than the non-poor. Perhaps the disadvantaged are willing to join in the decision-making process because they are more likely to benefit from targeted poverty alleviation policies and the improvement of social security.
Subjective evaluation of social equity
To some extent, the subjective evaluation of individuals in social equity can reflect how much social exclusion they feel in a society. Researchers have created a section in the CSS’s questionnaires to evaluate how respondents assess various major social issues. Five questions associated with relative poverty were chosen, including public medical treatment, employment opportunities, income distribution, social insurance, and rights in urban and rural areas. Respondents were required to mark how they think of something as “very unfair” to “very fair” on a scale of one to four. Researchers have come up with the mean value of different groups of people in the time frame of 2015 to 2019.
A horizontal comparison shows that respondents gave the lowest credit to urban-rural rights equity, whose mean value was close to “somewhat unfair.” In particular, the relatively poor have given an even lower mark to this question than the non-poor group. This indicates that a strong social exclusion against the relatively poor remains in the current social system, especially the rural migrant workers who are struggling to acquire equal rights with the urban locals.
A vertical comparison shows that both groups of respondents gave a mark of 2.7 to 2.9 for public medical treatment, which fell in the zone of “quite fair.” The relatively poor gave slightly higher credit to public medical treatment than the other group. The markings for the employment rate did not differ much between the two groups either, with the result falling in between “not so fair” and “somewhat fair.” In terms of income distribution, both groups gave a low rating, which stood at “not so fair” in 2015 and remained lower than other questions despite a minor increase from 2017 to 2019. Both groups marked social insurance as “somewhat fair,” with the relatively poor giving a slightly higher rating than their counterpart. In general, “rights” and “income distribution” got lower marks while the other three dimensions were rated close to “somewhat fair.”
Data analysis shows that the vulnerable poor suffer from weaker human capital compared with that of the non-poor. As for employment, the ratio of non-agricultural employment of the relatively poor is significantly lower than that of the non-poor. In terms of social participation, Chinese residents’ general ratio is low. The participation proportion of the relatively poor is slightly higher than that of the non-poor. In the subjective judgment of social equality, subjects give the equality of “urban and rural rights” and “income distribution” low marks. The relatively poor rate the above two dimensions lower than the non-poor do.
Data shows that the relatively poor are still excluded by society to a certain degree in multiple dimensions such as education, employment, social participation, and urban and rural social rights. Looking ahead, China needs to introduce social policy reform in multiple dimensions in order to gradually reduce social inequality.
Wang Jing is from the Institute of Sociology at the Chinese Academy of Social Sciences.
Edited by WENG RONG